|
|||||||||||
 |
|||||||||||
ResourcesThis page offers downloads of analytical resources that you can use for yoru own projects. |
|
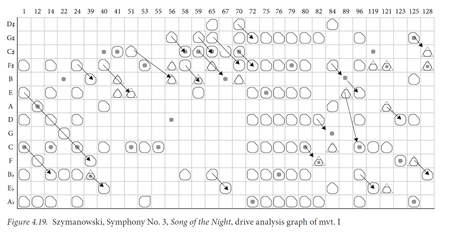
Drive Analysis GraphsThese grids are set in Adobe Illustrator or MS Word and allow you to map the configurations of dominant-seventh chords and their common variants that are often superimposed to form more complex sonorities. In line with the psychoanalytical aspects of the book, I call these "drives." The full explanation of this system is given in chapter 4 - using Karol Szymaonwski's works as examples. The method works particualrly well with post-Wagnerian composers who have a strong element of diatonic drive beneath the highly chromatic surfaces of extended tonality. The image on the right requires the "legend" for the shapes that are plotted in the graph. You can download these resources as a zip-file, containing the Illustrator file (or a blank grid in Word format plus avatar images), and the legend. The .eps file to use with Adobe Illustrator is best for printing. You should also have the free Bach font installed (for sharps and flats). [Note, please keep the Word files saved as version 97; the image quality of the hi-res avatars decreases when saved as later versions.] |
A "drive analysis" graph of Szymanowski's Song of the Night, showing the various patterns formed by the sumperimposed tonal drives. Arrows show the various resolutions that are nested within the complex harmonies. |
Functional Space GraphsThese graphs record chord progressions through the tonal space discussed in the book. The nodes on these graphs represent chords, with four minor-third relations (vertical ) representing the same tonal function (T, S or D). These functions rotate through space as we move along the line of fifhts (horizontal). The space is used in the book to capture the sense of tonal motion through chromatic substitution in various twentieth-century composers such as Richard Strauss, Charles Ives, Szymanowski, Skryabin. To draw these I use Adobe Illustrator, though blank pdfs are contained in the Zip folder for rough-work / teaching purposes.
|
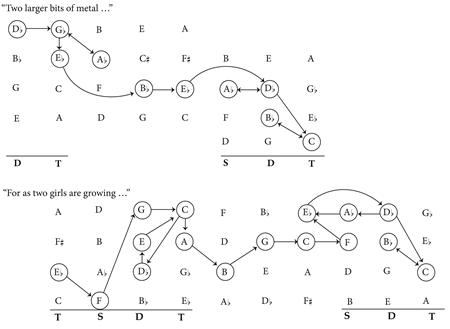
This functional space graph compares two stanzas of an aria from Copland's opera The Tender Land, showing a fundamental progression that drives from left-to-right along a cycle of fifths, but passes through minor-third / tritone substitutions. The second stanza is more complex and daring in its motion. |