|
Users' Guide V1.3 Drive Analyzer is a tool for analysing musical events (chords/notes) in an xml music score; it searches for common chord configurations (triads / sevenths etc). It shows results in a grid and can export PDF output. It is a useful method of analysing 20th century art-music in the western tradition, which, through its tonal complexity, often obscures diatonic drive. It may, however, have other uses. The method of musical analysis – “drive analysis” – is explained in this video, as well as at the bottom of this page, and complements Kenneth Smith’s book, Desire in Chromatic Harmony (OUP, 2020). As an advanced feature, the program further allows users to track “entropy” across the course of a piece as described in the article, “The Enigma of Entropy in Extended Tonality” (Music Theory Spectrum 43, no. 1, 2021). Installation Download the latest version and open the zip file. The programme requires no installation. However, because I have no security certificate, your operating system is likely to try and prevent the file opening. This will require you to insist; be firm with your OS – don’t let it win. Load XML
Settings
The settings dialog contains the following options: click “apply” to operate the profile and re-load the analysis: Analysis ModeChoose the fundamental approach for analyzing your music:
Include triadsThis setting allows users to include or exclude triads from the analysis. (Because, in drive analysis, triads are considered to have a weaker sense of drive than most seventh chords, users may not wish to include them in the search). Include anacrusisIn pieces which commonly have an “up-beat”, this option may be useful. It joins the upbeat to the subsequent chordal analysis. Arpeggio searchingWhere chords are commonly constructed as arpeggios (i.e., the notes are not literally all present at the same time), turn this option on. Neighbour notesThis option records both passing notes in the melody and any neighbour notes that resonate with a recognisable chord in the harmony. Be warned, this can lead to a heavily populated graph. Remove repeated patternsIn music with significant repetition, it can be desirable to reduce the chord progressions to show patterns only once. For example, when selected, this option will reduce a pattern of events ABABA to ABA. It will, however, allow ABCAB. Include non-drive eventsWhere four-pitches that do not produce a common chord are found together, this option registers only the bass note. This is only recorded at moments where there are no other common chords present. Thus, the pitches c, c#, d might yield the result: “no recognisable drive (bass C)”, put the pitches c, c#, d, g, b would still record “G” as a triad. Sustain PedalSimulates piano sustain pedal to create richer harmonic analysis:
Duration FilterEnabled: Excludes notes shorter than the specified duration (32nd notes, 16th notes, 8th notes, or quarter notes) to focus on structurally significant events. Event Change SensitivityControls how events are grouped and merged:
Drive Strength ConfigurationOpens advanced dialog to customize individual chord type strength values (affects priority and color coding) and harmonic priority hierarchies. Show Grid Show resolution patternsThis produces arrows where drives move to their related local “tonic”. Assuming no global tonic, the option simply shows patterns of local V-I or II-V progression. It only considers the root, and does not consider the modal quality of the chord. Colour-code chordsWhen checked, this codes the chords in terms of their strength. The strongest chords are rendered in black; the weakest in white or light grey. Strength is determined by 8 variables; the inner-workings of this formula can be examined by clicking "show entropy" and exploring the grid contained there. You can change these values in the settings. Show entropyThis is an advanced feature, following the method of calculating entropy shown in this video. In brief, the feature calculates the tonal “randomness” at any given moment. The strength of each chord within a complex is modelled and returned as a probability score, essentially asking the question: “if any one of these chords is going to resolve; what’s the chances of it being this one?” This is then fed into Claude Shannon’s formula for calculating “entropy” or “information” (measured in bits) and plotted on a line graph beneath the main grid. The individual variables used to calculate the probabilities (strengths) themselves are shown on a list at the foot of the pop-up window table of information. Save as pdfThis option produces a beautifully rendered pdf version of the scrollable window. Save / Load Keyboard
|
|---|
|
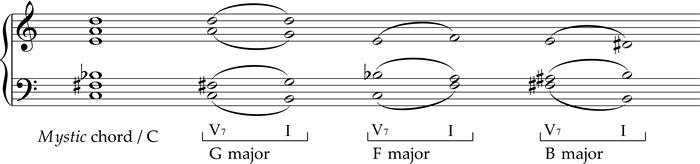
What is drive analysis? Pick any five or six pitches on the keyboard (above)—something dense, maybe even strange, ideally a sound you’ve never stumbled across before. Beneath your chord, you’ll see several labels appear. These aren’t meant as the “true” name of the chord, but as glimpses into the tug-of-war between different tonal centers—those subtle inner harmonies that often jostle for attention in music beyond the Common Practice era. Each of these hidden “chords within the chord” is genuinely there, woven into the larger sonority, even if we wouldn’t usually use them as the main label. Think of them as signposts pointing to the chord’s delicious ambiguity. [Watch my video about it here] Have a look at the famous “Mystic” chord below, used by Scriabin, Szymanowski, and even found in jazz. This chord has been interpreted in many ways: as nearly octatonic, nearly whole-tone, a synthetic chord derived from the acoustic overtone series, or a jazzy V13(#7). The theory in drive analysis doesn’t contradict any of these views, but instead explores the various tonal pulls—what I call “drives” (a term borrowed from Freudian theory, in which humans are influenced by multiple partial drives pulling in different directions at once).
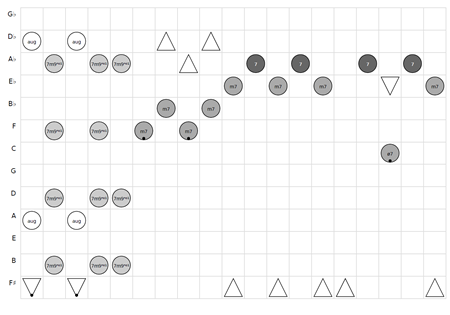
First, play the chord—either in real life or using the keyboard above—then resolve it as described in the three examples to the right. Each resolution will sound a bit surprising at first, but once your ear adjusts, each will feel natural, even inevitable. These three “drives” are therefore in conflict, each vying for resolution. In some ways, this might even model the way human listening works. What does it look like? If you do it the way I do, you’ll end up with a large grid: the cycle of fifths runs down the y-axis, and “time” (in a flexible sense) runs along the x-axis. The “drives” present are marked with symbols. In Desire in Chromatic Harmony I used one particular set of symbols, but the Harmonic Drive Analyzer program uses a simpler code. Circles represent 4-note chords (the darker the circle, the stronger the drive), while triangles represent triads (optional here, since in this style of harmony they tend to carry less tension). Bass notes are shown with dots. A grid might look something like this:
|
|---|
| Version History | |
| Version 1.3 (January 2026) |
Added Features
|
| Version 1.2 (1st Septmebr 2025) |
Added Features
|
| Version 1.1 (26th August 2025) |
Added Features
|
| Version 1.0 (8th August 2025) |
Features
Known Problems
Planned Developments
|
© Kenneth Forkert-Smith, University of Liverpool